Purpose: This NPA report produces a count of legal Problem Types by Law Type. It also contains various filters that allow the narrowing or expansion of the search in relation to specific Service Types, Administrative Boundaries, Office Location and Outreach. Multiple combinations of fields is possible, which makes the report highly customisable. This report is useful for those wanting to see the breakdown of services further broken down by Law Types and Administrative Boundaries.
Filter Panel
Set the filter panel for the required reporting period. The below are some examples of date range that are commonly used.
Filter
Detail
Start Date
End Date
Funding Categories
All CLSP Funding Types
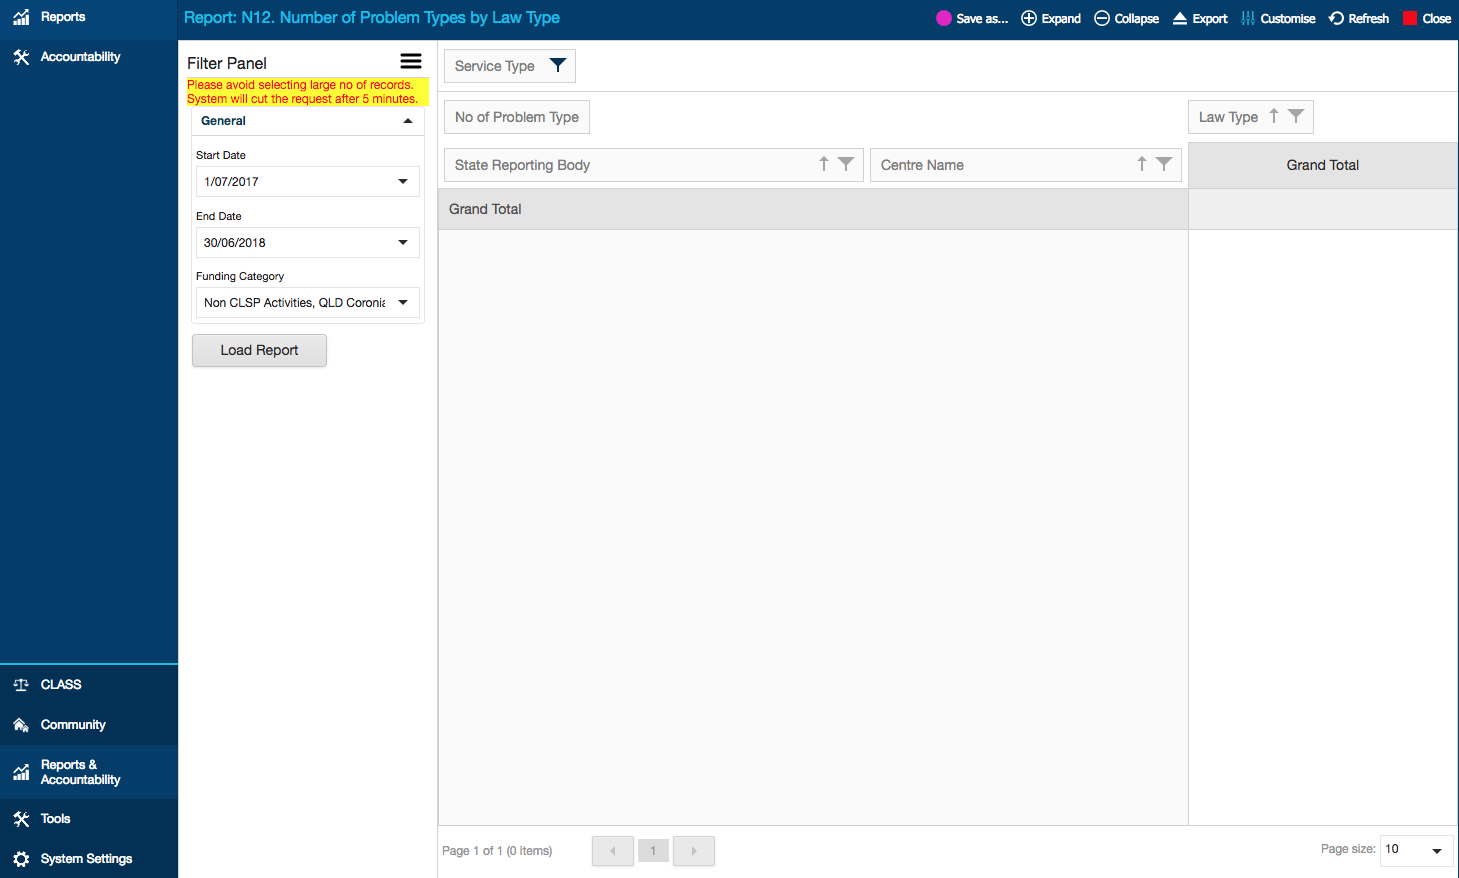
First Look
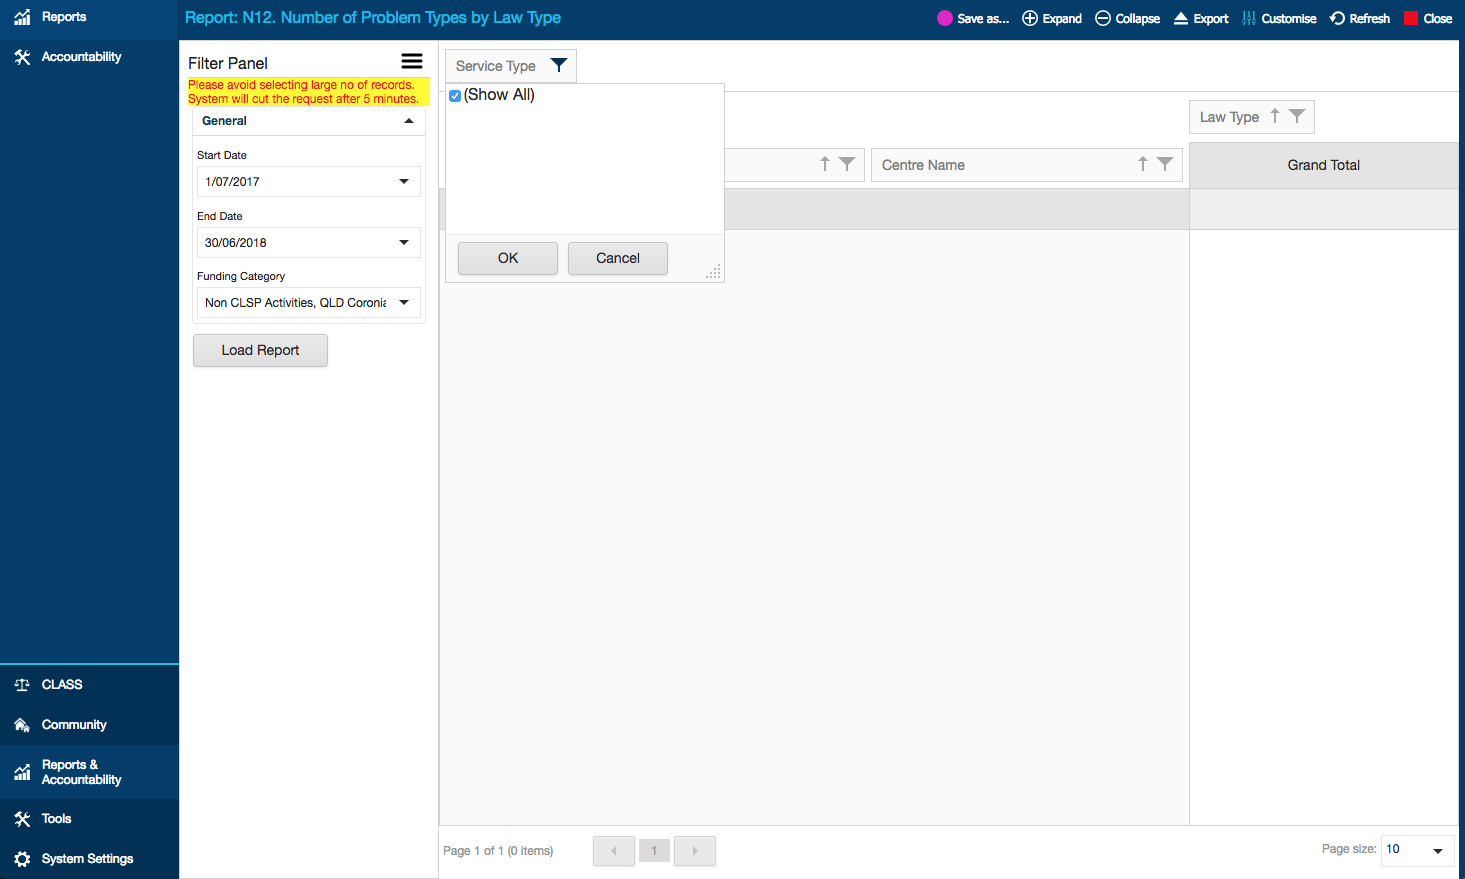
This is the first look of N12 when it is freshly opened up.
If you open up the Service Type filter before clicking “Load Report,” the box will only contain (Show All) options. Load report once.
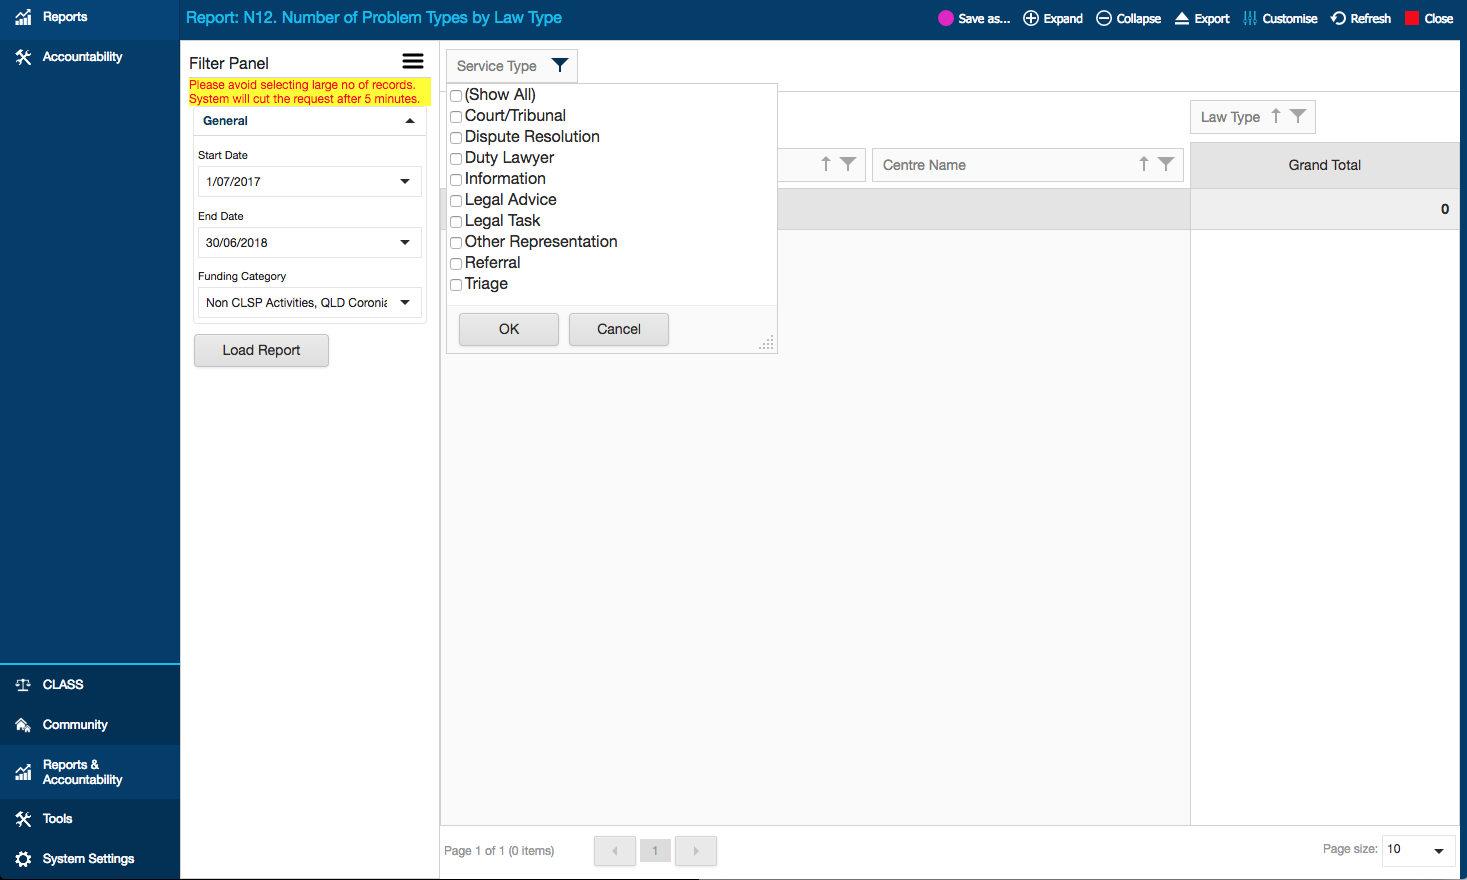
After loading report once and THEN clicking on the Service Type filter will reveal the Service Type options that can be chosen for the report.
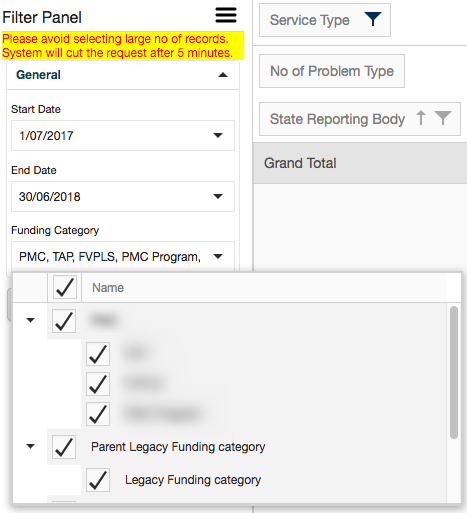
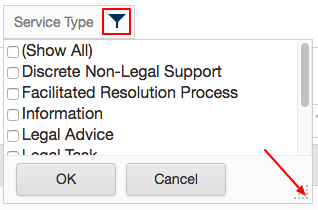
Check Filters
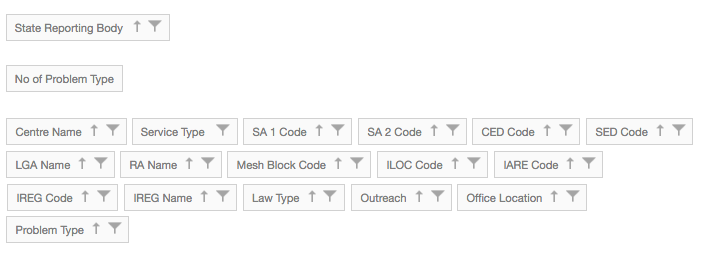
Use the filter icon to expand each filter. The dotted triangle at the bottom right corner of the box can be dragged to enlarge or reduce the size of the box.
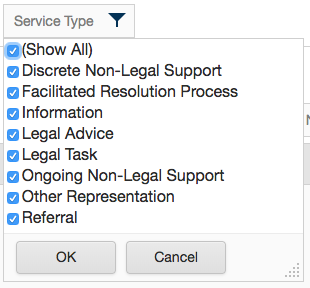
Tick relevant boxes to expand or narrow down the search.
The options that appear in the box will only show the fields that have been entered at your centre. For example, your centre does not provide Facilitated Resolution Process and never inputted any entry on this service, this option will not appear in the expanded box. This same logic applies to other filters. If there was no client from the Local Government Area of North Sydney Council served in the selected reporting period, this option will not appear in the expanded LGA Name filter.
Available Filters
All the filters can be used via the same mechanism as above. They function like Pivot Table filters in Excel, used to narrow down or expand different combinations of categories.
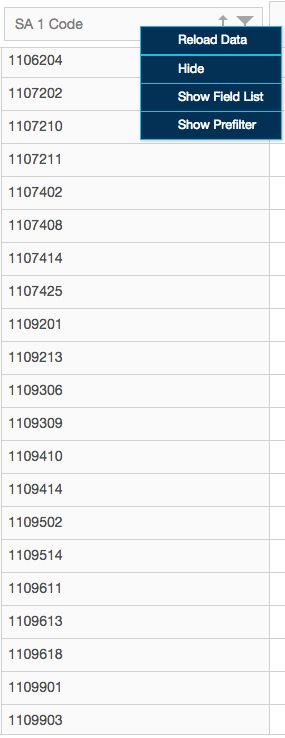
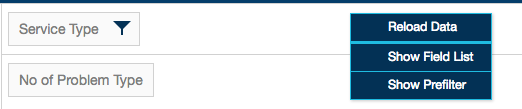
Most of these fields are hidden when the report is initially opened. Right-clicking on the white area of the report, as seen below, opens up three courses of action to be chosen. Clicking on “Show Field List” opens up a pop-up window from which new fields can be added to the report.
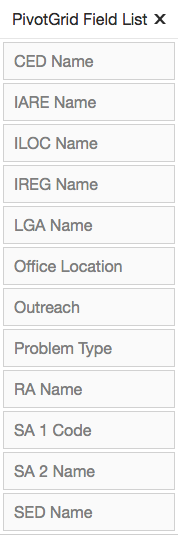
Show Field List
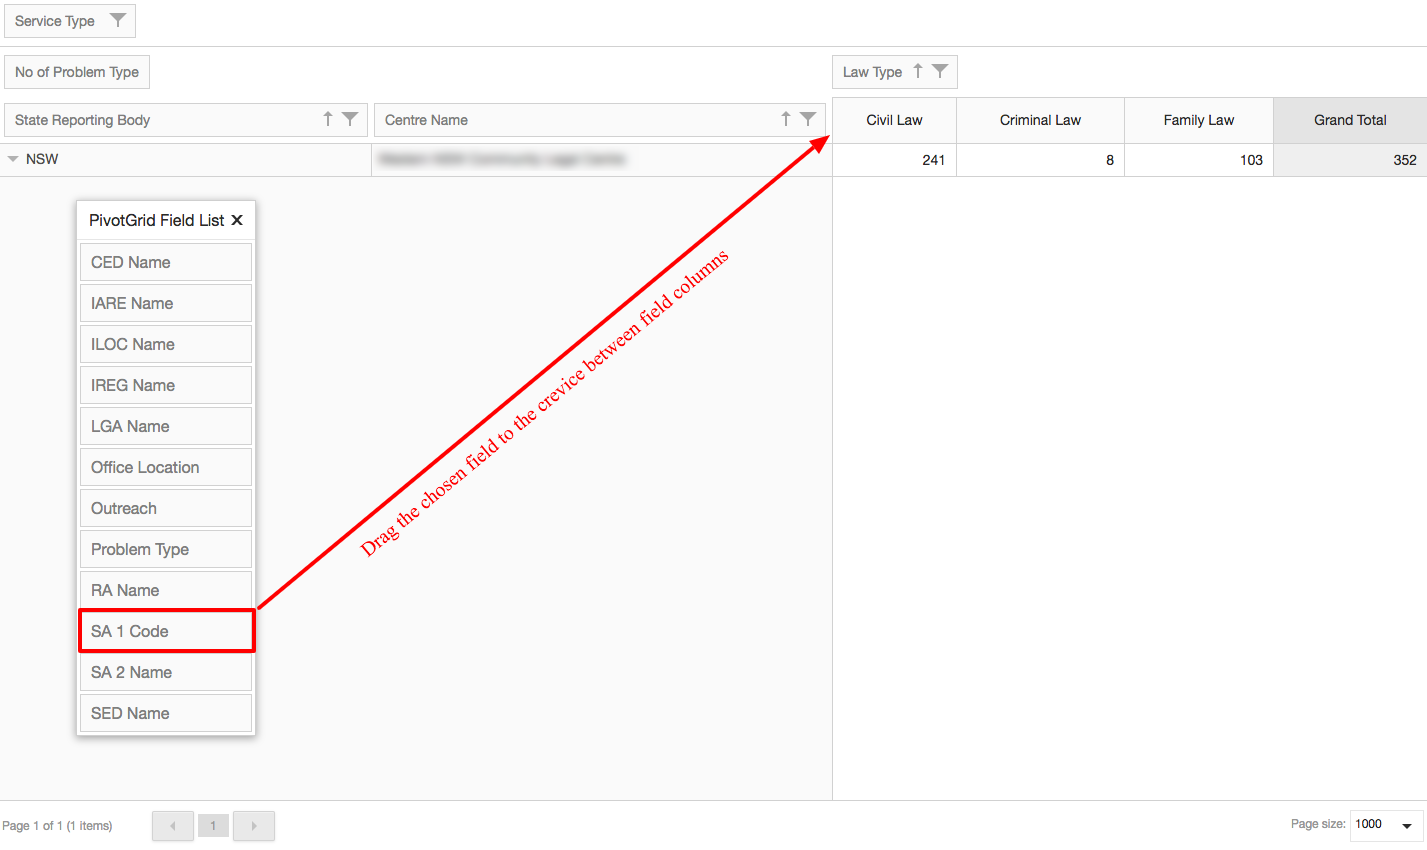
These fields from the Field List can be dragged into the report.
Simply drag the chosen field to the crevice between existing columns.
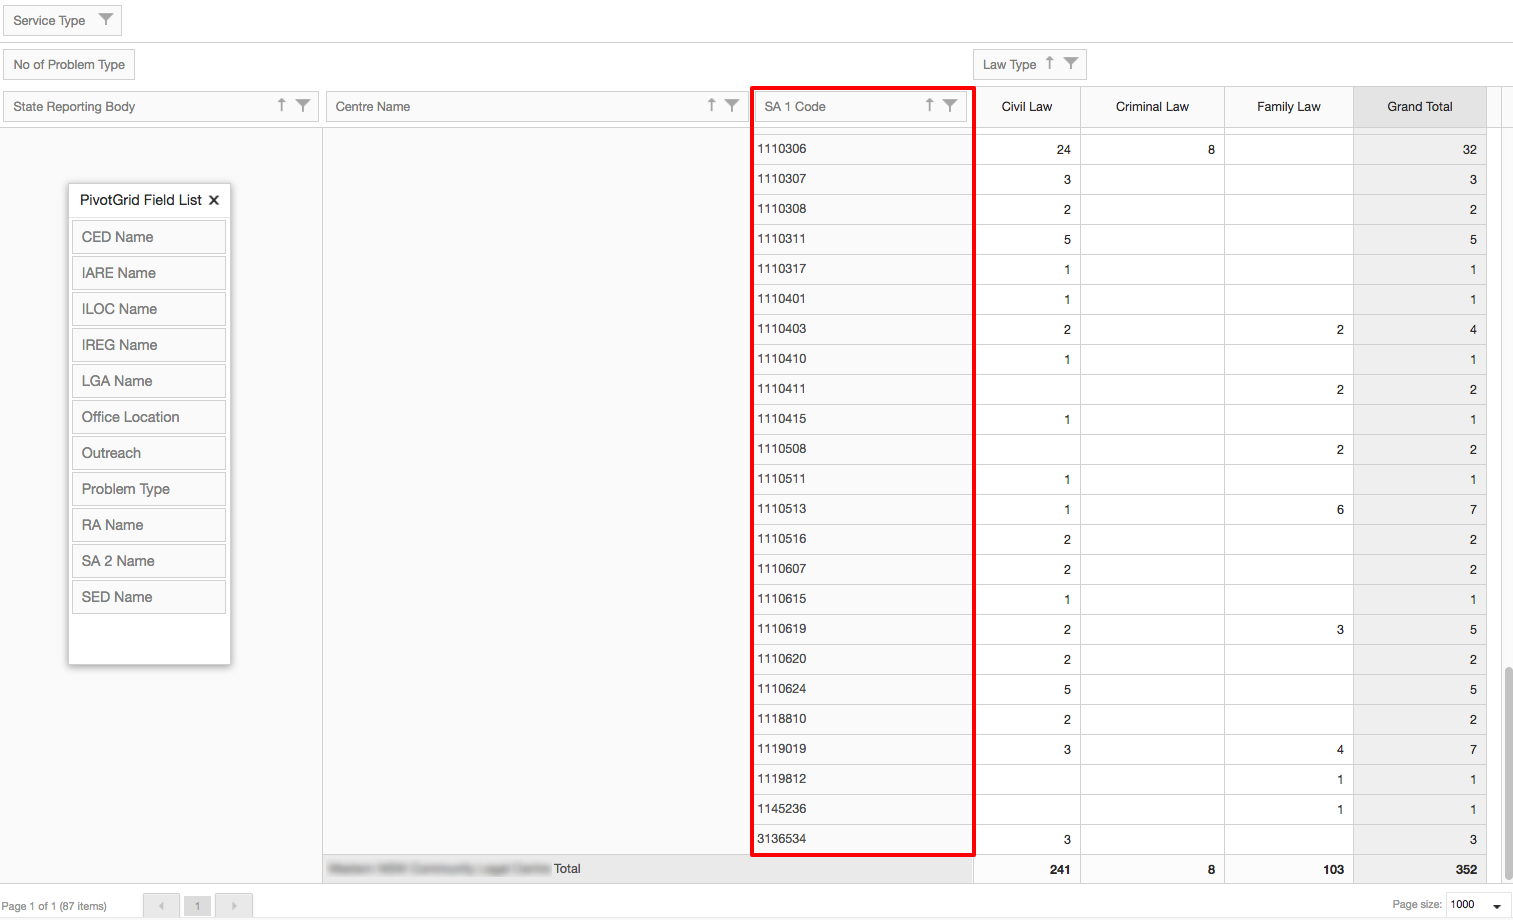
Dragging the SA1 Code into the report adds the SA1 column, which shows breakdown of SA1 administrative boundary data. The same principle applies to all other fields.
Show Prefilter
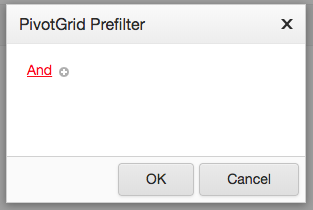
Selecting “Show Prefilter” option opens up a pop-up window, “PivotGrid Prefilter.”
Clicking on the small “plus”sign will add a new row that begins with CED Code.
Clicking on blue CED Code will open up list of field options to choose from. Selecting “Law Type” will change the CED Code to Law Type.
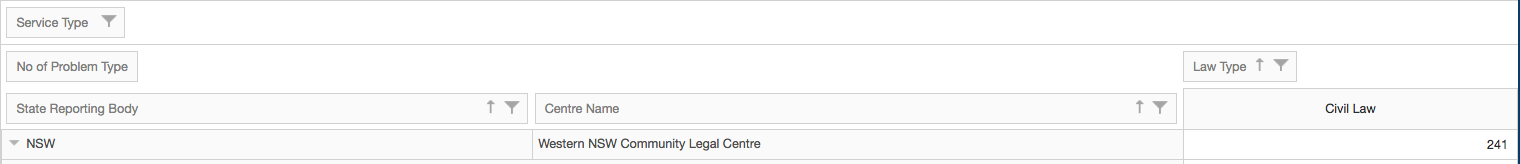
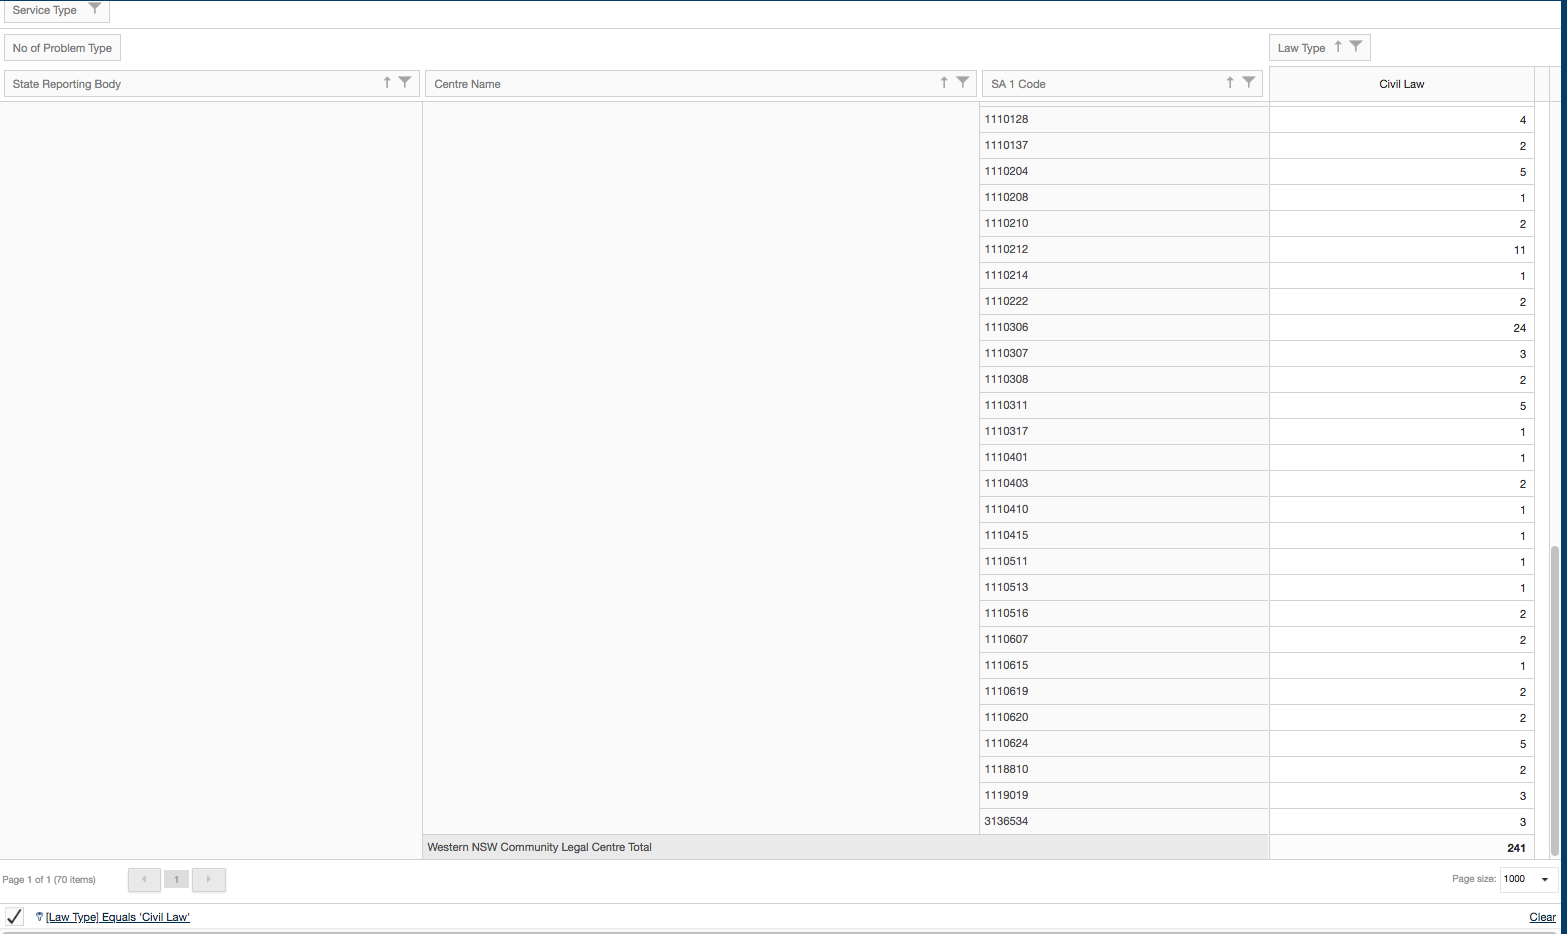
Clicking on <enter a value> opens up available options. Clicking on Civil Law will restrict the search result to Civil Law only.
Dragging another Field column to this report, such as SA1 Code, will show results SA1 administrative boundary only in relation to Civil Law type.
Right-clicking on the visible filter column also gives the option to “Hide” this column. Once hidden, this field will be kept under PivotGrid Field List box.
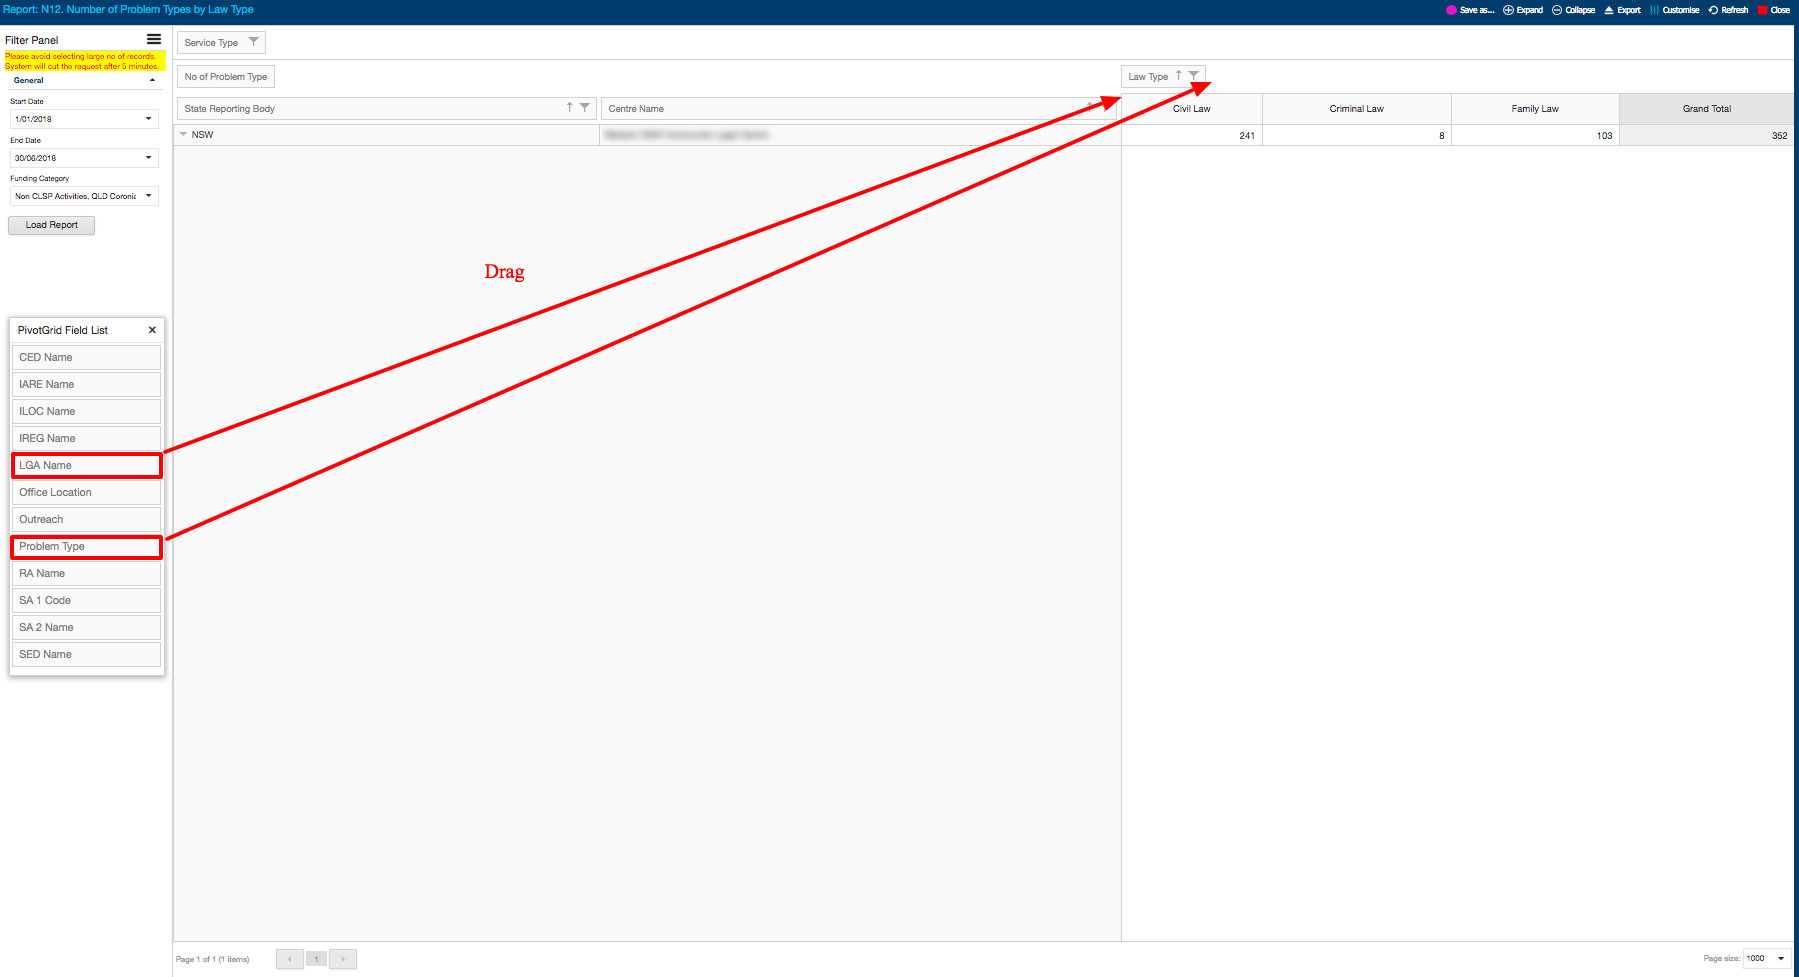
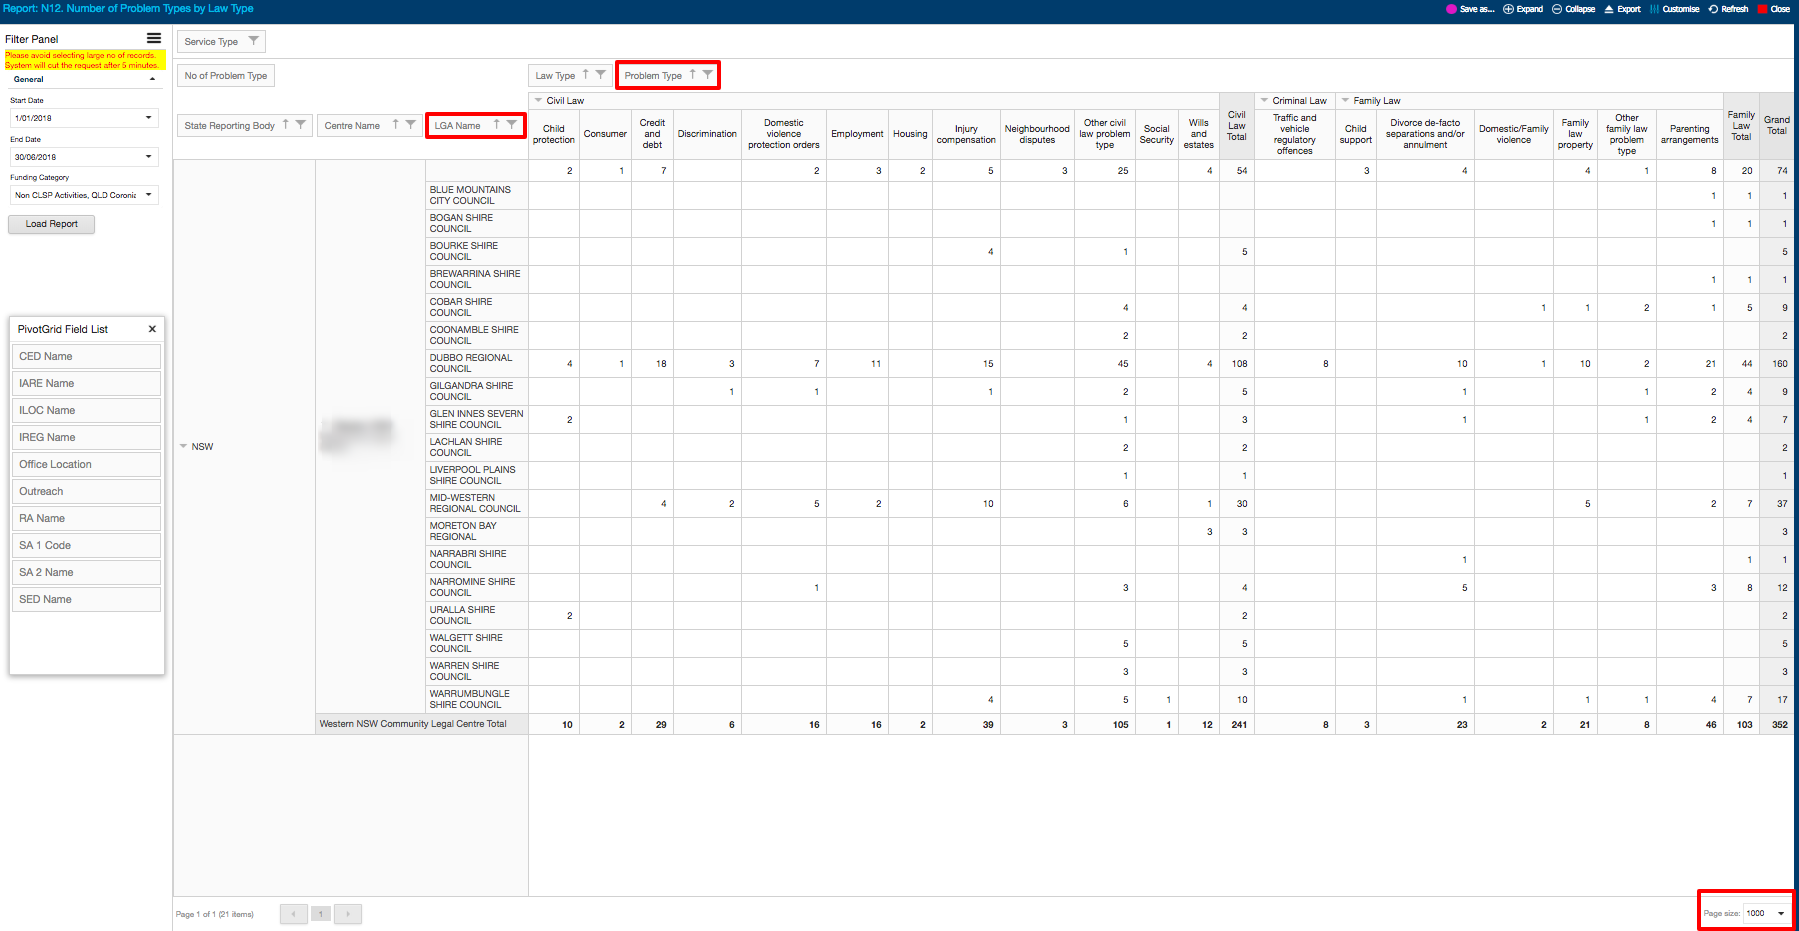
Using Both Axes
Dragging of fields can be done to either axis. For example, one can find the breakdown of Problem Types further broken down by Local Government Areas, by adding relevant fields to appropriate axes.
Here, LGA Name filter has been added to be listed in rows; Problem Type filter has been added to be listed in columns.
Also note that selecting “Page Size” (located at the bottom right corner) as 1000 allows one to see maximum data in a single page, best serving the purpose of this report.

 sign will add a new row that begins with CED Code.