Previously known as: CC2 ClientDemo by Percentile
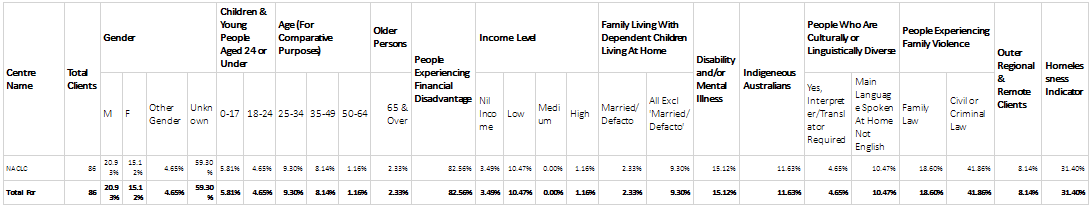
Purpose: This report shows the demographic breakdown of clients who have been identified to be in Priority groups (defined by the NPA). The Total Clients column is shown as a number while the columns are displayed in percentages. Some Priority Group columns are further broken down into sub-categories, and these %’s across the entire Priority Group should add up to 100%. Columns without sub-categories show a % figure in comparison to the Total Clients.
This report is identical to C01 except instead of numbers of clients C02 shows % of the Total Clients.
This reporting on percentages shows the distribution of vulnerable clients, allowing one to see at a glance if these prioritised groups of clients are receiving most assistance compared to other groups that are considered less vulnerable. For example, most CLCs should aspire to see higher percentages in Nil or Low Income columns and lower in Medium or High Income.
Columns Show:
Rows show:
Report Type: Standard
This report can be ‘filtered’ so that the results are limited to data that meets the criteria chosen in the filter panel. The filters available for this report are
For more information – see the page on filters
The following should be considered when analysing this report
Total Clients |
|---|
Number of unique clients that had a service (not including Information, Referral and Triage services) delivered in the reporting period where: Service Type is Legal Advice OR Discrete Non-Legal Support OR Facilitated Resolution Process OR Duty Lawyer AND Date of Service/Open Date is ≥ Start of Period AND ≤ End of Period OR Service Type is Ongoing Non-Legal Support OR Legal Task OR Dispute Resolution OR Court/Tribunal OR Other Representation AND Close date ≥ Start of Period AND ≤ End of Period |
| Gender | ||
|---|---|---|
| Male | Female | Other |
Percentage of clients where: Gender is mapped to Male DIVIDED BY Total Clients x 100 | Percentage of clients where: Gender is mapped to Female DIVIDED BY Total Clients x 100 | Percentage of clients where: Gender is mapped to Other DIVIDED BY Total Clients x 100 |
Children and Young People aged 24 or under | Age (for comparative purposes) | Older Persons | |||
|---|---|---|---|---|---|
0-17 | 18-24 | 25-34 | 35-49 | 50-64 | 65 & over |
Percentage of clients where: Client service open date – client date of birth is between 0-17 DIVIDED BY Total Clients x 100 | Percentage of clients where: Client service open date – client date of birth is between 18-24 DIVIDED BY Total Clients x 100 | Percentage of clients where: Client service open date – client date of birth is between 25-34 DIVIDED BY Total Clients x 100 | Percentage of clients where: Client service open date – client date of birth is between 35-49 DIVIDED BY Total Clients x 100 | Percentage of clients where: Client service open date – client date of birth is between 50-64 DIVIDED BY Total Clients x 100 | Percentage of clients where: Client service open date – client date of birth is ≥ 65 DIVIDED BY Total Clients x 100 |
| People Experiencing Financial Disadvantage | Income Level* | |||
|---|---|---|---|---|
| Nil income | Low | Medium | High | |
Percentage of clients where: Financial disadvantage indicator value is mapped with ‘Other’ in the Types & Categories / Total Clients * 100 | Percentage of clients where: income level is mapped to ‘Nil income’ / Total Clients * 100 | Percentage of clients where: income level is mapped to ‘Low ($1-$599) / Total Clients * 100 | Percentage of clients where: income level is mapped to ‘Medium ($600-$1000)’ / Total Clients * 100 | Percentage of clients where: income level is mapped to High ($1250+)’ / Total Clients * 100 |
| Family Living with Dependent Children Living at Home* | |
|---|---|
| Married/De facto | All excluding ‘Married/De facto’ |
Percentage of clients where: ANY Service has [The number of dependent children is ≥ 1 AND (relationship status is mapped with ‘Married (registered and de facto)’] OR Family Type is mapped with ‘Two parent family with dependent children’) / Total Clients * 100 | Percentage of clients where: ANY Service has [The number of dependent children is ≥ 1 AND (relationship status is NOT mapped with ‘Married (registered and de facto)’] OR Family Type is mapped with ‘Sole parent family with dependent children’) / Total Clients * 100 |
Disability and/or Mental Illness |
|---|
Percentage of clients where: ANY Disability Status is mapped with ‘YES’ in the Types & Categories / Total Clients * 100 |
Indigenous Australians |
|---|
Percentage of clients where: Aboriginal & Torres Strait Islander Status is mapped with ‘Yes’ OR ‘Yes, Aboriginal’ OR ‘Yes, Torres Strait Islander’ OR ‘Both Aboriginal and Torres Strait Islander’ / Total Clients * 100 |
People who are culturally or linguistically diverse | |
|---|---|
Requires Interpreter | Main language spoken at home not English |
Percentage of clients where: Requires Interpreter value is mapped with ‘Yes’ / Total Clients * 100 | Percentage of clients where: Main Language Spoken at Home value is not equal to ‘English’. OR Unknown OR Not Stated OR Not Applicable / Total Clients * 100 |
People experiencing Family Violence | |
|---|---|
Family Law | Civil or Criminal Law |
Percentage of clients where: Family Violence Indicator is mapped with ‘YES’ in the Types & Categories AND problem type map type = Family Law / Total Clients * 100 | Percentage of clients where: Family Violence Indicator is mapped with ‘YES’ in the Types & Categories AND problem type map type = Civil Law OR Criminal Law / Total Clients * 100 |
Outer Regional and Remote Clients* |
|---|
Percentage of clients where: Service in Regional Area = outer regional OR Remote OR Very Remote / Total Clients * 100 |
Homelessness Indicator |
|---|
Percentage of clients where: Homelessness indicator value is mapped with ‘Yes’ in the Types & Categories / Total Clients * 100 |
Refer to the Data Consistency Guide for definitions of Service types such as Discrete Services, Ongoing Services and Community Projects.