Make it faster
- Using less fields and/or shorter time periods for your DIY report will make it run faster.
- Avoid entering start and end dates for the DIY report until you have set up the row, column, filter and qualifier fields you need, as it is much faster moving fields around without the report trying to load results each time.
- When you have built your report, try running the report with a small date range to begin with, so you can see if the field layout you have selected and overall logic works. From here you can expand the date range to get the results you want. If you are running a very large report you may need to break it up into years, months, etc.
Two structures
There are 2 basic structures you can use when building a DIY report:
List view report
The first is a ‘list view’ – essentially a table of information.
List views are more about displaying information than they are about statistics.
- Examples of this might include:
- A list of centre workers by name, and services assigned to them by service ID, service type, client ID, client first name, client last name, service status
- A list of clients showing client first name, client last name, client email address, a custom field indicating whether they agree to be emailed for feedback.
A good example of this is CLASS DIY report Recipe 1: Enhanced Service Search with a Custom field, which you can find in the DIY recipes section.
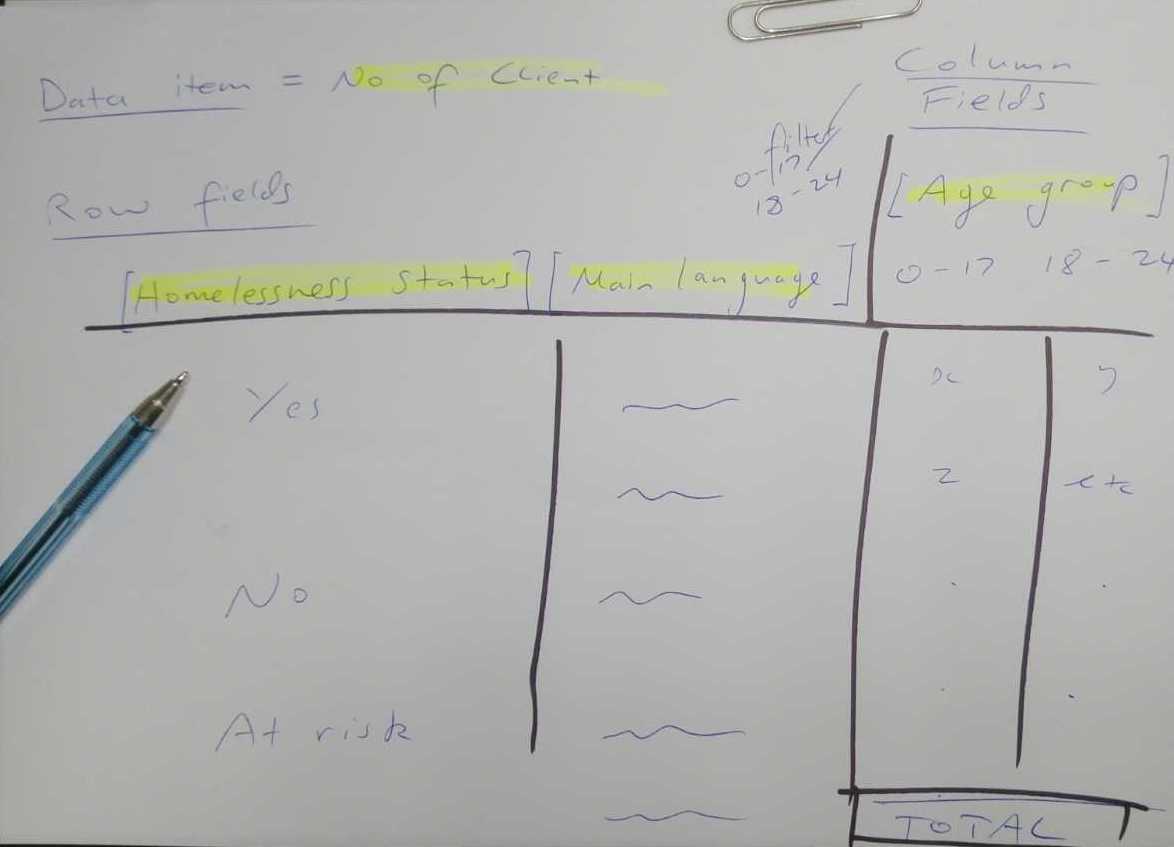
Sum/ ‘number of… ‘ report
The second is a more traditional Sum/ ‘Number of… ‘ report – counting number of clients/ services/ actions/ additional parties etc
This style of report is more about displaying stats than unique client/ service/ project information.
- Examples of this might include:
- The number of clients who speak a main language other than English, by language.
- The number of actions, by action type, attached to different service types.
- The number of services where a particular field has a value of ‘blank’ (in order to amend records)
An important tool in sum/ ‘number of… ‘ reports is ‘sub-time periods’. These are time period fields like ‘day’, ‘week’, ‘month’ etc which you can drop into the column section to divide up the ‘number of …’ results across the relevant sub-time periods.
A good example of this is CLASS DIY report Recipe 7: Number of Actions by Action type report, which you can find in the DIY recipes section.
Other report structures
You might use ‘number of fields’ in a list view, or use unique identifiers in a ‘number of …’ report. The above structures are the two archetypes you can build as reports.
Which DIY template to use?
DIY Service Client is the catch-all DIY Report. It has the most fields from across the widest area of CLASS. However, some fields are not included. For this reason, there are a number of specialised add-on reports:
Some advanced Tips
- There are of course other ways of building DIY reports – you could have a list view style but still performing a ‘number of …’ count on something.
- We have a table of all standard fields and which DIY template reports they are available in.
- Most custom fields should appear in the pivotgrid field list for DIY Service Client template and their respective other templates e.g. a client custom field should also appear in DIY Client Additional Details template.
- New custom fields may require refreshing/ clear cache to appear in the pivotgrid field list.
- Depending on excel formatting, you are able to slot the results into National Map
- If there is specific data you need to compare which is only available across multiple template reports, you can use a unique value common across reports e.g. service ID to join two different DIY reports in excel etc. We do not endorse this as there are security concerns with moving your data outside of CLASS.
Does the report already exist?
Always consider if the results you are after would be better handled by an existing report? The standard reports are pre-made, fast and well tested.
Testing and documentation phase
Note that we may not be able to provide detailed assistance with DIY reports until we have more complete production testing and documentation.
We are best placed to provide assistance based on concepts around our existing documentation, videos and DIY recipes.