DIY Recipe 1: Enhanced Search Service with Custom Field

Purpose

The purpose of this report is to generate Service lists and figures in relation to custom fields.

Step-by-step guide

Initial setup

  1. Open DIY Service Client in reports.
  2. Select ‘Save As’, name your report something descriptive, tick save changes if you want (applies to new report – and you can toggle later).
  3. The saved-as and newly named report should open in a new CLASS tab. From here on we are using this new DIY report.

Field placement and filters

  • Right click near the top and select ‘Show Field List’. You can expand the PivotGrid Field List box to make it easier to see (see the screenshot below).

One at a time, select the following fields and drag and drop them into the ‘Drop Row Fields Here‘ section of the DIY report in the following order (note you can Ctrl+F / Cmd+F to search the page):

  • Service ID, Client ID, First Name, Last Name, Open Date, Assigned To and relevant Custom Field. Look to the screenshots for a better picture of where we are placing them.

Select the following field and drag and drop into the ‘Drop Data Items Here’ section of the DIY report:

  • No of Services or No of Clients (depending on what you are searching for – are you searching for a count of clients or services?). Here, I selected No of Service to find the Service count. 
  • Set the ‘additional reporting dates’ dropdown on the left hand side to ‘Service Open Date‘ – this is necessary to show currently open but not closed services. If you are only searching for completed services, select ‘Service Date (Completed Service)’.
  • Select all the available funding categories, or a specific funding category depending on your need.
  • Make sure to check ‘Include Custom Fields‘ and keep ‘Show All Dates’ unchecked.
  • Set a selected date range, and load the report.
     
  •  THE REPORT – best to do this even if you previously ticked ‘save changes’, just to ensure that the settings are saved for future uses.
  • This new report should only be available to the creator. Use the  button to allow different levels of access to this report on a role/user basis. More information on this in ‘DIY Basics and Tips’ page.


Example report

Below is an example using fake clients/data to illustrate options you might want to use.

Further options

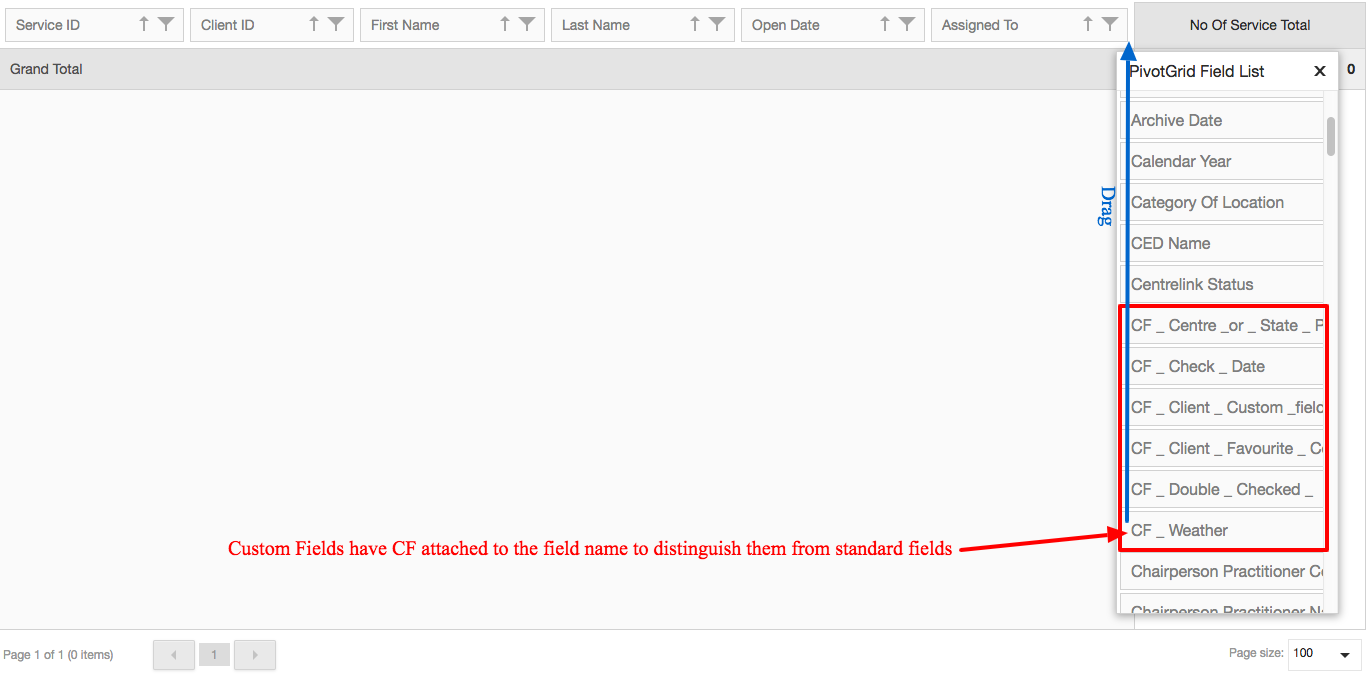
You can interchange any of the row fields – i.e. you might want more or less information displayed, including priority fields such as Aboriginal and Torres Strait Islander status, homelessness status, family violence, age group etc.

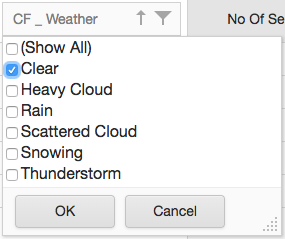
You can use the button on any of the field names to filter the results. For example, you may only want to see the services with the custom field response, ‘Clear.’ Clicking on  opens up the box of field options, which you can use to narrow down or expand search results.

Search