DIY Recipe 3: Report showing results by Sub-Time Periods

Purpose

The purpose of this report is to generate figures for number of services broken down by service types and sub-time periods, such as in days, weeks, months, quarters or years.

Step-by-step guide

Initial Set-up

  • Open DIY Service Client in reports. 
  • Select ‘Save As’, name your report something descriptive, tick save changes if you want (applies to new report – and you can toggle later).


  • The saved-as and newly named report should open in a new CLASS tab. From here on we are using this new DIY report.


Field placement and filters

  • Right click near the top and select ‘Show field list’. You can expand the box to make it easier to see.

One at a time, select the following fields and drag and drop them into the relevant section of the DIY report in the following order (note you can Ctrl+F / Cmd+F to search the page):

  • Drop Service Type into Drop Row Fields Here.

Drop Week and Day into Drop Column Fields Here.

Drop No of Service into Drop Data Items Here.

Set the ‘additional reporting dates’ dropdown on the left hand side to ‘Service Open Date‘ – this is necessary to show currently open but not closed services. If you are only searching for completed services, select ‘Service Date (Completed Service)’.

  • Select all funding categories or a specific one needed. 
  • If you check Show All Dates in the Filter Panel, this will show all days of the week, including the days when no service was provided (i.e. Sundays). If you leave the box unchecked, the report will only display dates with services provided.
  • Set a selected date range, and load the report. 
  •  THE REPORT – best to do this even if you previously ticked ‘save changes’, just to ensure that the settings are saved for future uses.
  • This new report should only be available to the creator. Use the  button to allow different levels of access to this report on a role/user basis. More information on this in ‘DIY Basics and Tips’ page.


Example report

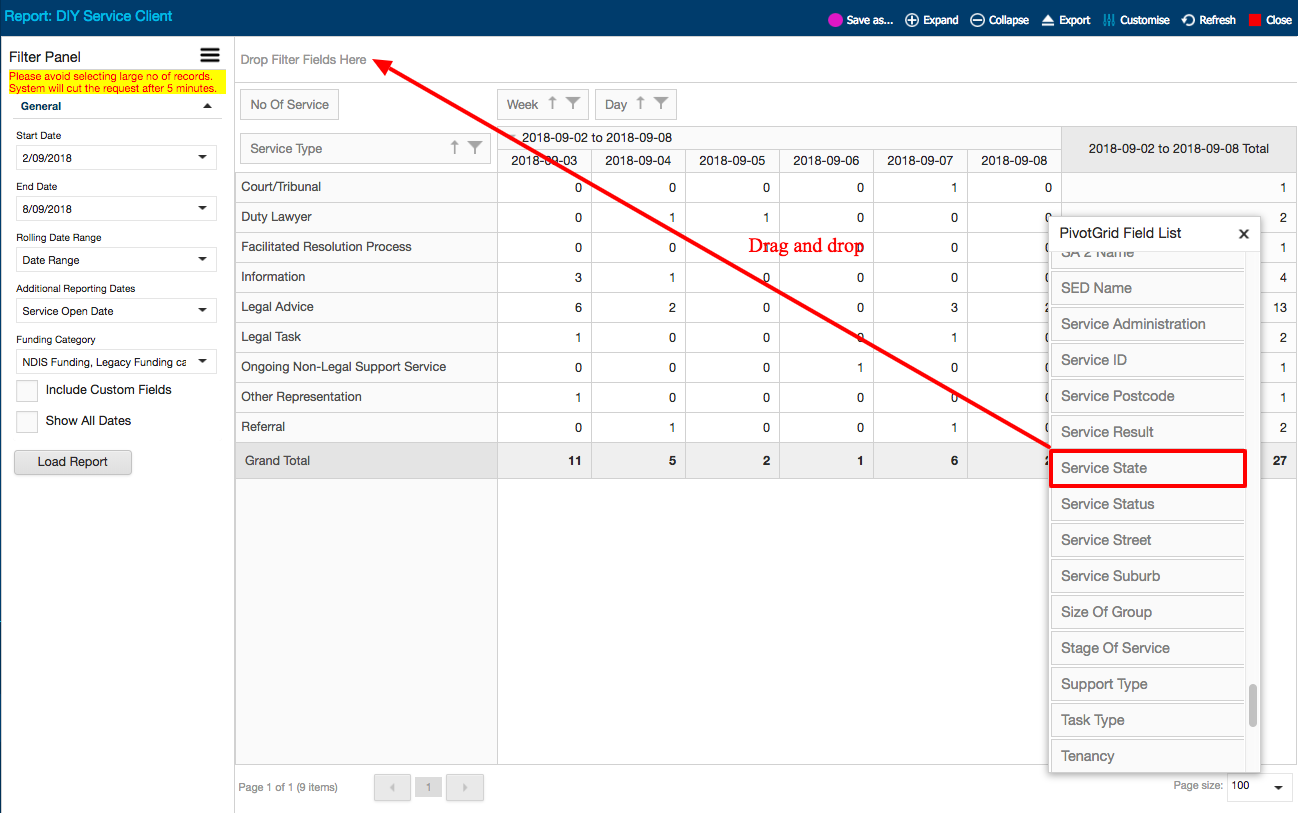
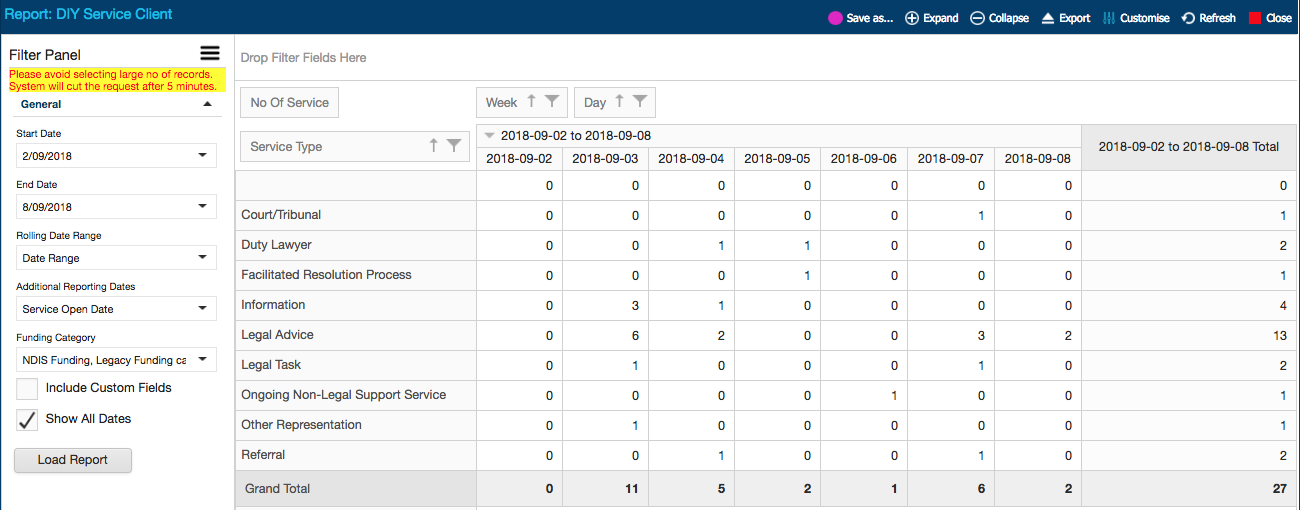
Below is an example using fake clients/data to illustrate options you might want to use. You can see different number of services provided under different dates, which is broken down by different Service Types. For example, 6 Legal Advices were provided on 2018-09-03, while only 1 Other Representation was provided on the same date. The column on the far right shows the total number of services in the selected week, also broken down by Service Types.

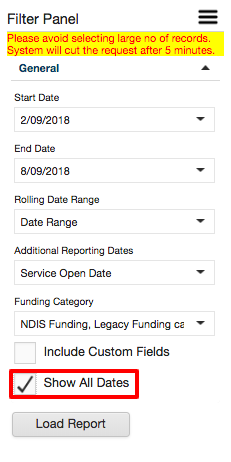
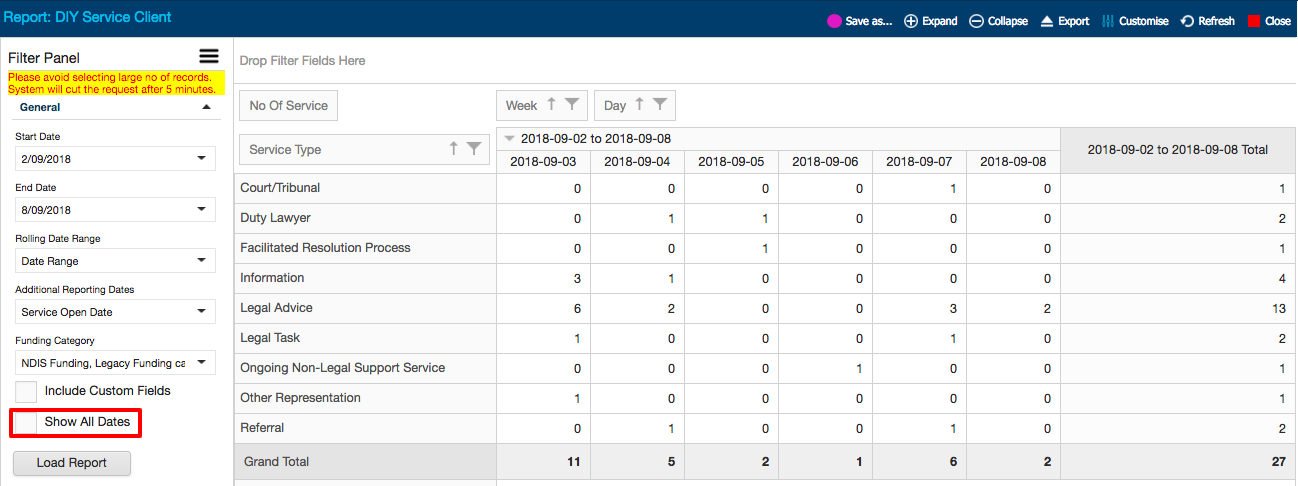
Also note that when Show All Dates is ticked, 0 service, provided on 2018-09-02 (Sunday) appears as the first column full of zeros.
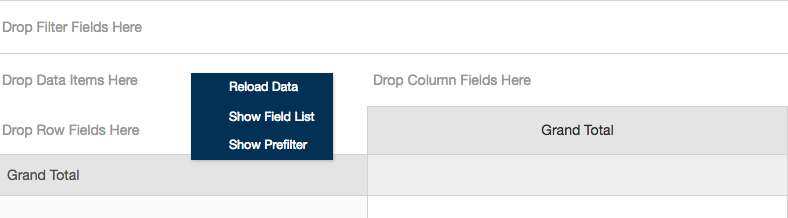
The report ran again with Show All Dates is unticked, removes the first column with no service provided.

Further options

You can use the  
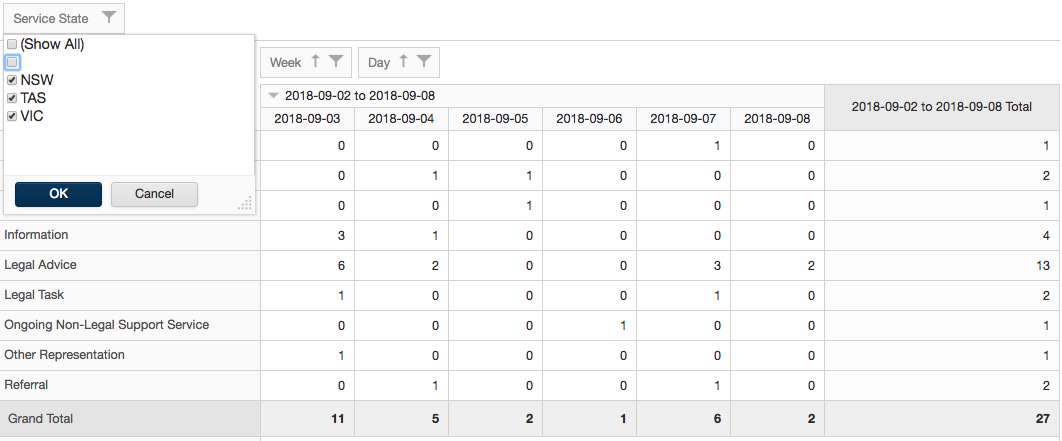
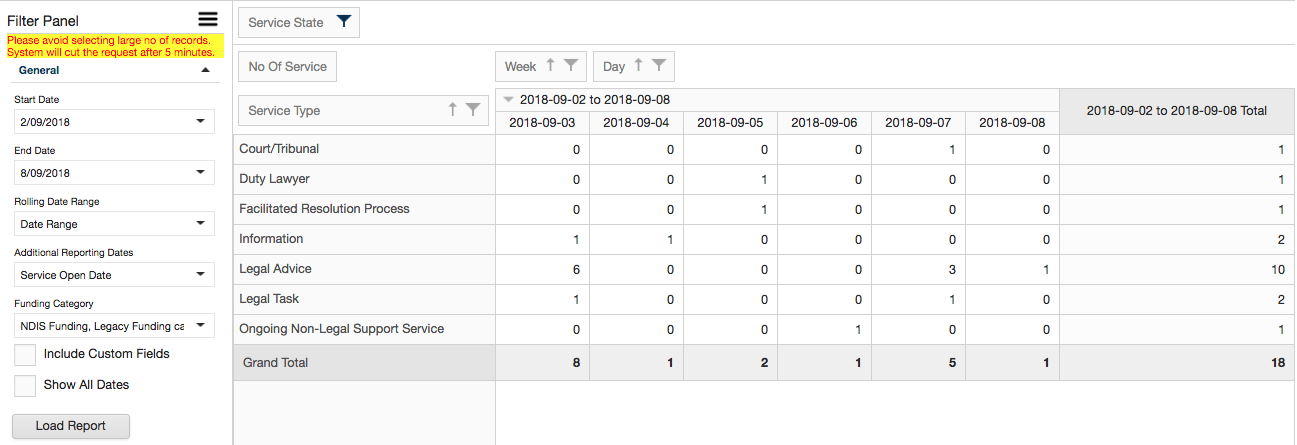
button on any of the field names to filter the results. For example, you may only want to see services provided in certain states. Dropping the Service Date field into Drop Filter Fields Here and Clicking on  opens up the box of field options pertinent to States, which you can use to narrow down or expand search results.

Here, unselecting the ‘blank’ field option (blank means there is no data entered in the field) is expected to narrow down the result. 

Grand total has been narrowed down from 27 to 18 when blank field was unselected from the filter.

Search