DIY Reports are an advanced feature of CLASS, allowing you to build, edit, and save your own tailor-made reports using a drag-and-drop style of interface. They are similar to existing Drilldown reports, but offer much more freedom in structure and fields displayed.
The basic layout of a DIY report is based around four areas:
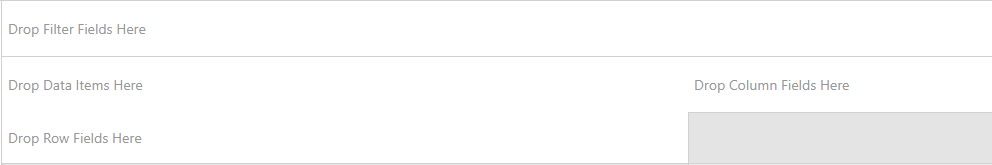
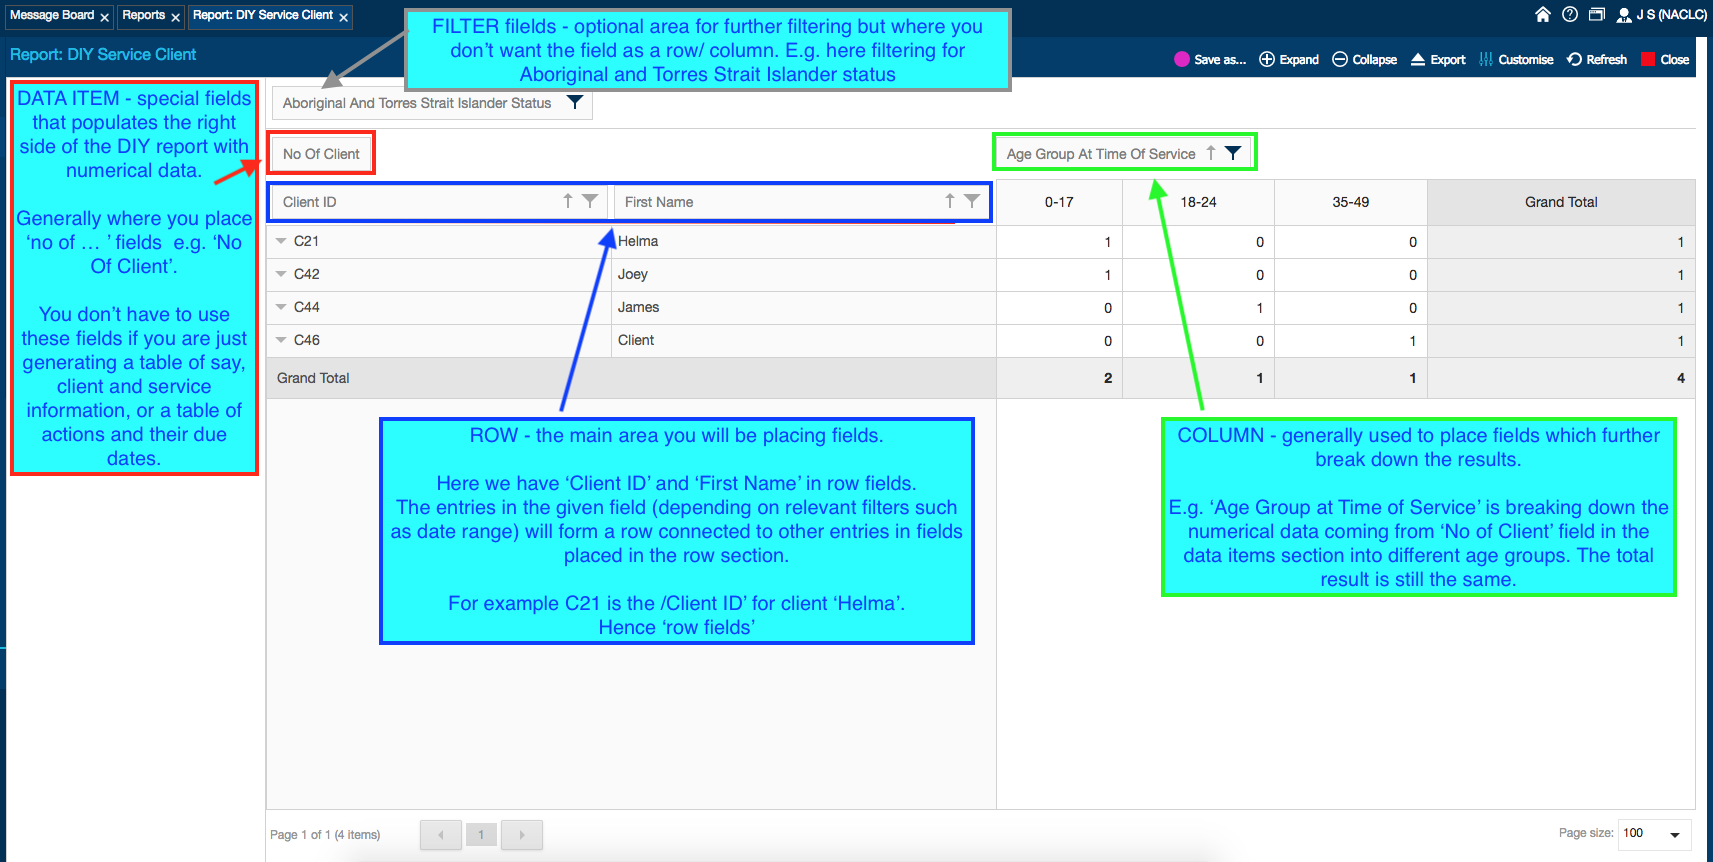
An essential part of DIY reports is the ability to add fields into the above sections of the report.
To view the list of fields you can drag and drop into these four sections, right click near the top of the report and select ‘field list’ or mouse over customise in the top right and select ‘column chooser’.

| Term | Meaning | ||||||||||||||||||||||||||||||||
|---|---|---|---|---|---|---|---|---|---|---|---|---|---|---|---|---|---|---|---|---|---|---|---|---|---|---|---|---|---|---|---|---|---|
DIY | Do It Yourself | ||||||||||||||||||||||||||||||||
| Additional reporting date | The reporting date in the standard reports is ‘completed service date’. This only looks at delivered services. Discrete services are considered delivered by their open date, but ongoing services only count as delivered by their close date. DIY reports give you the ability to select your reporting date, allowing you to look at services by their open or close dates, and so run reports that include incomplete services. More specific ones are found in other DIY template reports such as ‘action creation dates’. | ||||||||||||||||||||||||||||||||
| Sub time period | Time periods such as ‘day’, ‘week’, ‘month’ etc which are added to the report as fields (generally in the ‘column’ fields section’) in order to split the report results up by the specified sub time period. These do not change the totals of the report; they divide up the data into sections. | ||||||||||||||||||||||||||||||||
| ‘Show all dates’ checkbox | When this is ticked, ‘sub time periods’ where there would be no data will display as zeros. When this is not ticked, the column with no data will not appear at all. The purpose of this option is to allow reports showing all days/ weeks/ months etc in a normal looking format – eg show a full calendar month worth of days even if only some of those days had services recorded. This currently creates an addition row of zeros at the top of the report. These numbers mean nothing, they are just an effect of the checkbox. | ||||||||||||||||||||||||||||||||
| Template report | DIY Template reports are the core reports from which users can create and save DIY reports. There are multiple templates because of the underlying structure of CLASS -not all data could be viewed in one DIY report. Although much of what you will regularly use will be found in DIY Service-Client Template, some of the data in CLASS is only available through particular template reports for example most fields relating to service ‘actions’ are located in DIY Service-Action. You can edit template reports but you cannot save over them – you can save-as your edits and continue working on your DIY report, or you can save-as straight away from the template and work on your DIY report in the new copy. Most references to a ‘DIY report’ are referring to a non-template report. | ||||||||||||||||||||||||||||||||
| Recipe | Our video and/or written guides to creating specific DIY reports. These are a good way to learn DIY reports and also as templates to further customise and build your own reports based on centre need. These are located in the user manual at the bottom of the DIY section. | ||||||||||||||||||||||||||||||||
| Sharing/ Permissions | Controls available within a DIY report allowing you to set access to the report based on user role and/or specific users. You cannot share between centres/ state bodies/ etc due to strict security controls. | ||||||||||||||||||||||||||||||||
| Field | Standard fields, custom fields and special fields unique to DIY reports (such as ‘number of …’ and ‘sub time period’ fields) available within the ‘pivotgrid field list’ | ||||||||||||||||||||||||||||||||
| Pivotgrid field list | The name of the field selector used to drag fields onto the DIY report. This is accessed by right clicking near the top of the DIY report (around here where it says insert row fields here) and selecting field list OR clicking ‘customise columns’ in the top right. The field list can be expanded to make it easier to see. CMD+F/ Ctrl+F can be used to search for a field quickly. Note that custom fields have the ‘cf’ prefix, and some fields may have slightly different names to what you expect (e.g. client name appears as both ‘first name’ and ‘last name’). | ||||||||||||||||||||||||||||||||
| ‘Include Custom Fields’ checkbox | If you are using any custom fields in your report, you should tick this to see them properly in the DIY report. Note that if this field is unticked, you will still see custom field options in the field list, and some data may still appear, but the types within the custom field will not appear. | ||||||||||||||||||||||||||||||||
| Grouping (of rows) Left join | In DIY reports, rows will automatically group in like categories from left field to right field (or top to bottom), where possible. E.g. you have 1 client with 2 services attached. If client ID is in the left hand row field, and service ID is to the right of this, instead of repeating the client ID as:
It would INSTEAD appear with the client ID for this client grouped, eg:
Also note that if there is group-able fields to the right of unique fields (say in the above example, both services had a ‘favourite colour’ field and both services were marked ‘red’) these group-able fields will NOT group. e.g. it would appear as:
Following the grouping logic, if we move favourite colour field so that only non unique rows are on its left, it would group accordingly:
Note that this can also lead to ‘number of …’ problems. For example if we reorder the above example to so that the fields are arranged left to right as service ID, client ID we would get:
If we then ran this report with ‘number of clients’ in the data items section this client would be counted twice which is correct in the sense of the table, but of course incorrect in terms of the actual data. As such, if you are relying on the number of clients, services, etc plan to have the one you are interested in counting being placed such that its information is not repeated. This is something to consider when building reports and ordering fields. The easiest way to do this is to either keep the unique identifier e.g. client ID or service ID in the far left side, OR structure it in some way that duplicating does not occur. This is another reason to plan the report ahead and try to keep the DIY you are making simple. You can learn more about this by reading about SQL table joins, however the CLASS Helpdesk may not be able to provide deeper technical assistance on this. | ||||||||||||||||||||||||||||||||
| Sorting | You can only sort the left most column in a DIY report. This is a function of the way the data is pulled into the table. However, you can move fields around in DIY reports, so you can place the field you want to sort into the left hand side of the ‘row fields’ section. To sort the left hand row alphabetically/ numerically (depending on whether or not it is a standard/ custom field and whether the data is string or numerical), left click on the field name to toggle ascending/ descending. |