The best places to check an address, or to find the name or code of the administrative boundaries are ABS Maps and the NationalMap.
The CLASS Helpdesk would recommend ABS Maps as the most up to date place to check an address or location.
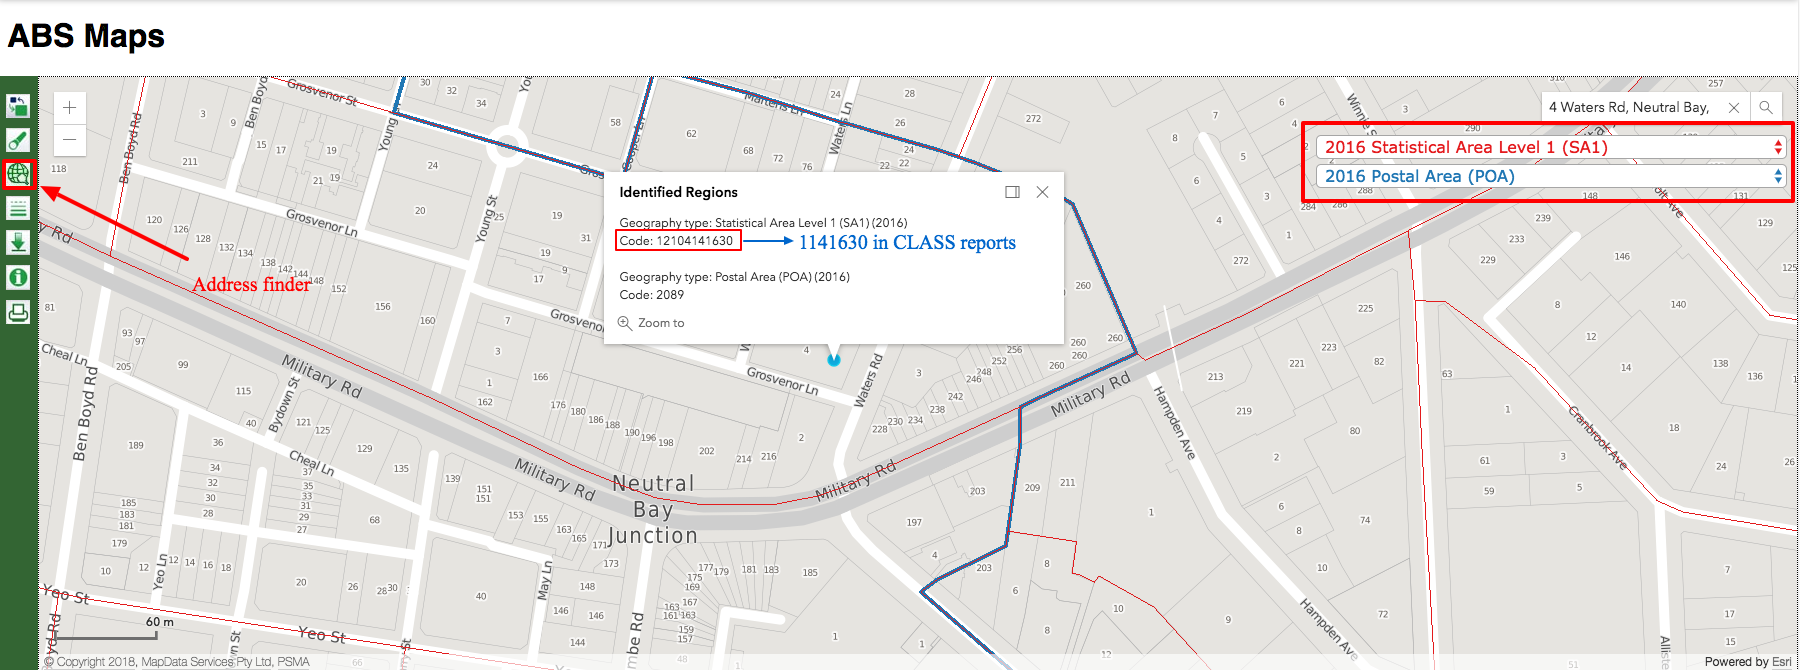
Entered a client living at the address, 4 Waters Road, Neutral Bay NSW 2089 in CLASS.
Users can look up this address on ABS Maps to see statistical boundaries associated with this address.
Users can select Administrative Boundary from the drop-down menu on the top right hand corner. In this example, 2016 SA1 was selected.
Searching the aforementioned address yielded the SA1 code 12104141630. A shortened 7-digit code of this, 1141630, is expected to appear in CLASS reports.
Eleven-digit code appearing in ABS Maps is drawn from SA1_MAINCODE_2016.
SA1 data appearing in CLASS reports are equivalent to SA1_7DIGITCODE_2016 which consists of 7-digits.
SA1_7DIGITCODE_2016 is made up of first and last six digits of SA1_MAINCODE_2016.
In this example, SA1_MAINCODE_2016 appearing in the ABS Maps is 12104141630.
Therefore, one can expect to see one client added to the SA1 code 1141630 in CLASS reports.
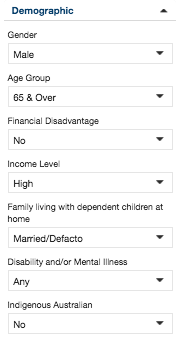
Because this client was specifically created for the purpose of demonstration, he was assigned a certain set of demographic characteristics.
For demonstration’s sake, the following demographic filters were applied in generating the C03 report.
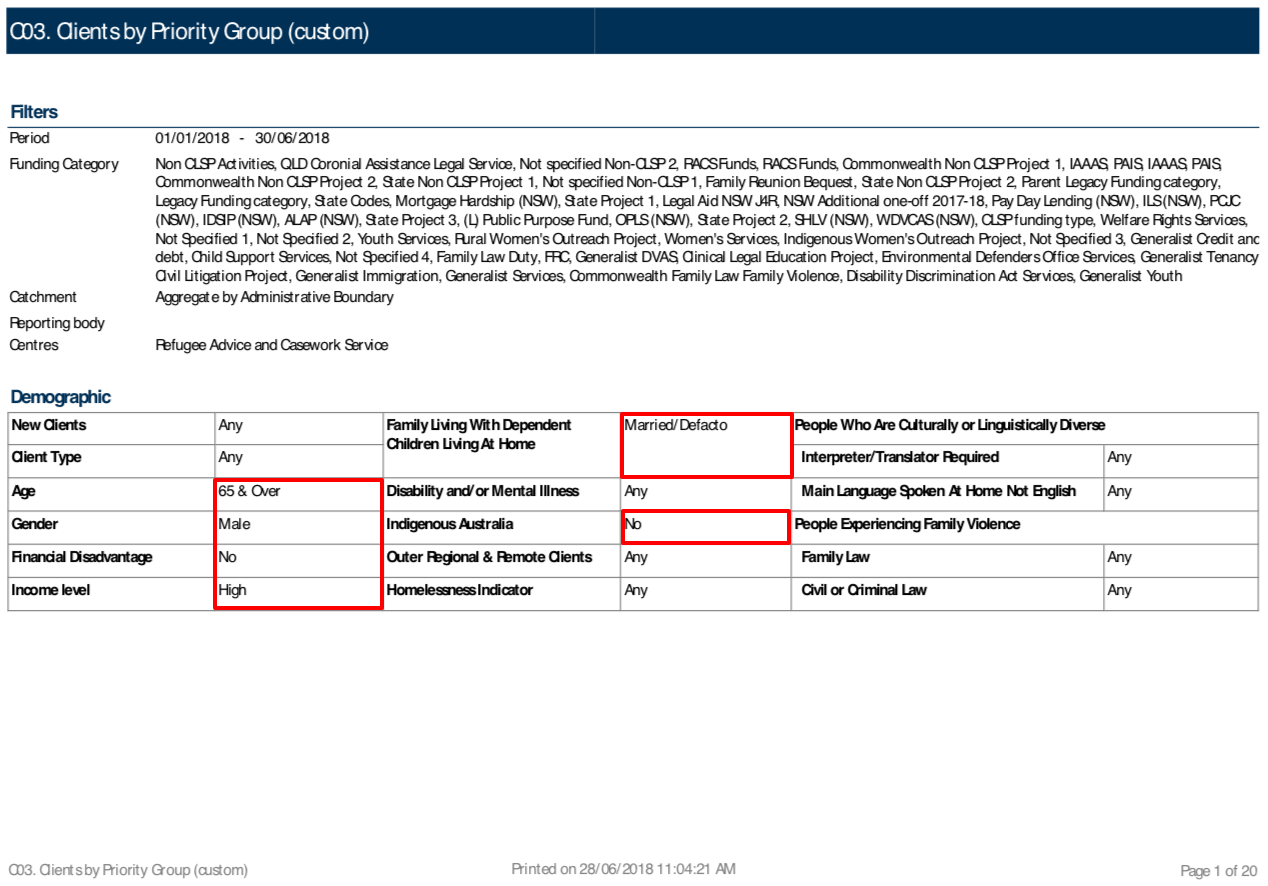
When filtered with above demographic filters, there was only one client who fit the selected criteria (the client added in this example).
As expected, 1 client was added to the SA1 code 1141630.

Users can also download various state-specific data packs from here to cross-reference with reports.
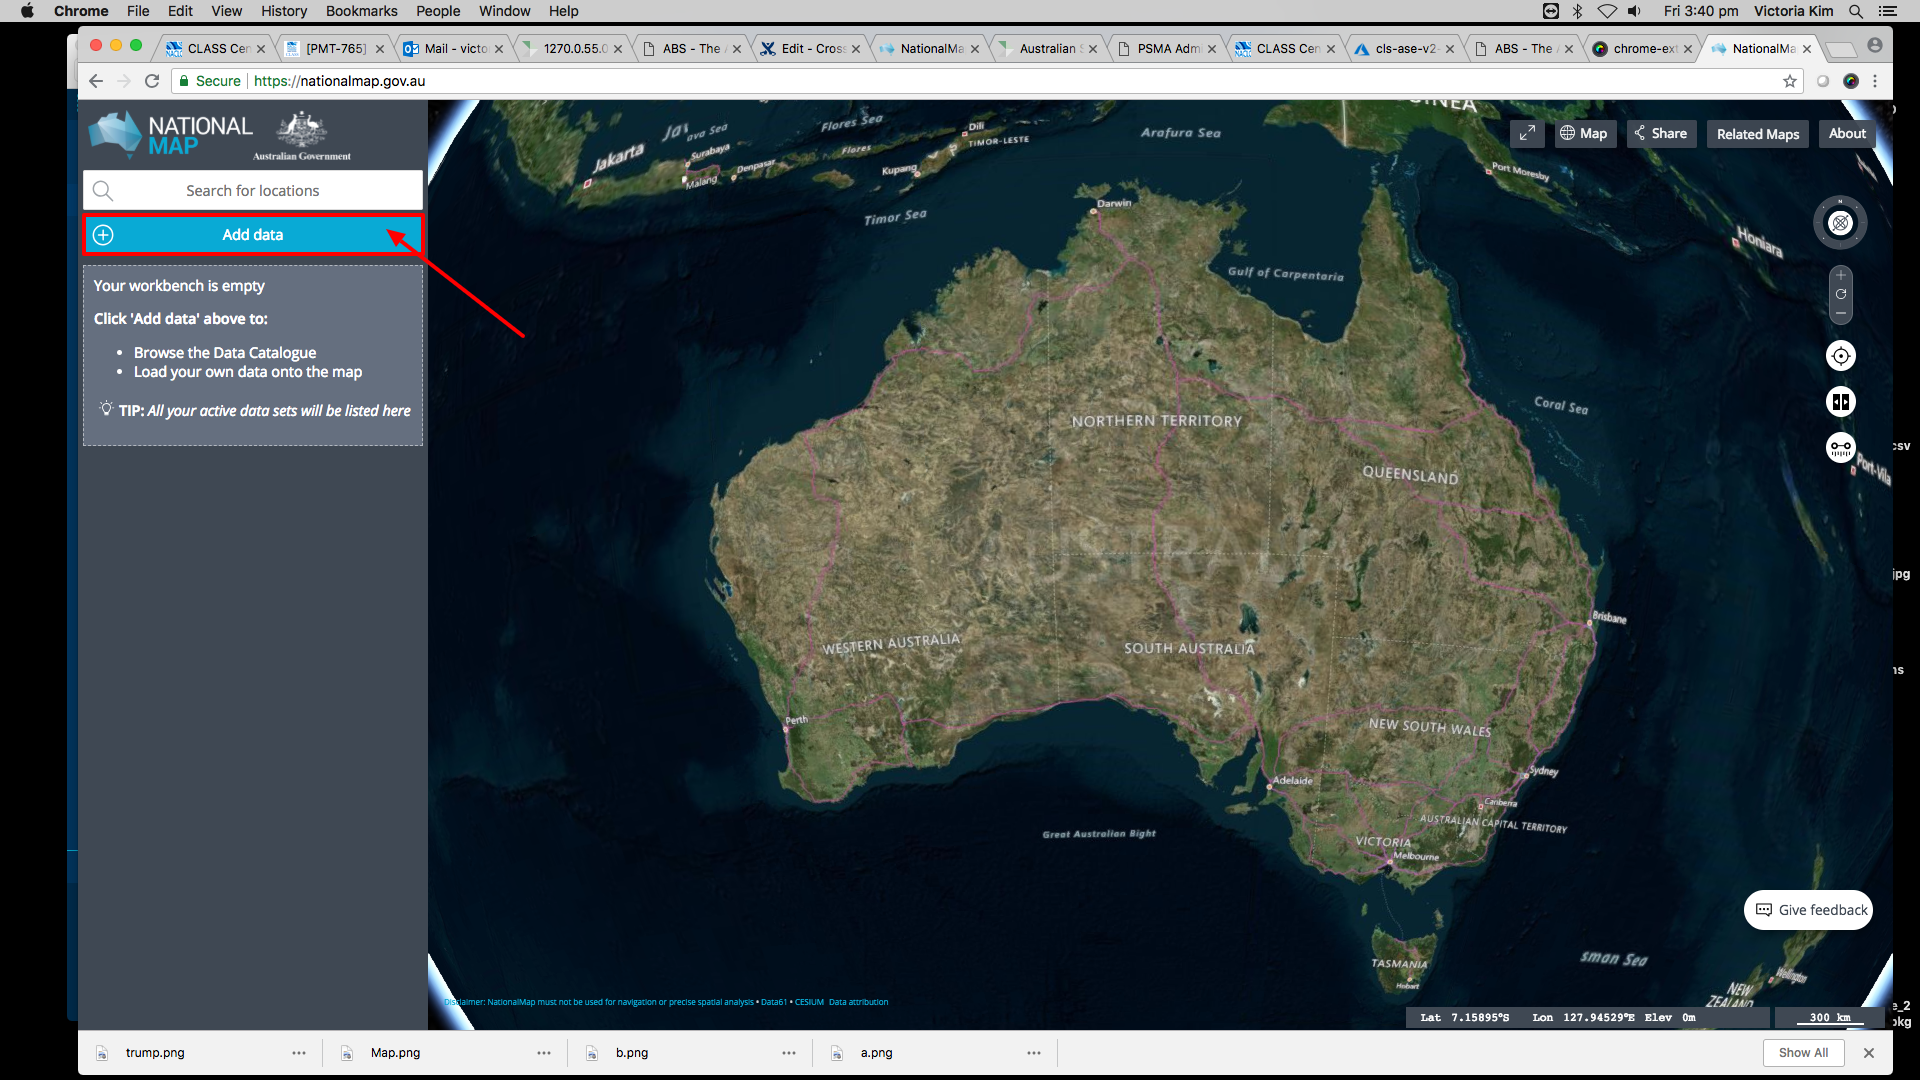
The NationalMap is a very powerful tool as it not only contains all the Administrative boundaries used by CLASS, it also has many other useful forms of data from various state, territory and federal government departments.
However, the NationalMap may not always have the very latest Administrative Boundaries. For example, the latest searching of SA2’s in the NationalMap indicate that they are not the latest data from 2017. They are from 2011, which means there may be some differences between the results yielded from CLASS reports and the NationalMap, particularly in the areas that have been recently changed (such as newly drawn boundaries, as a result of new infrastructure).
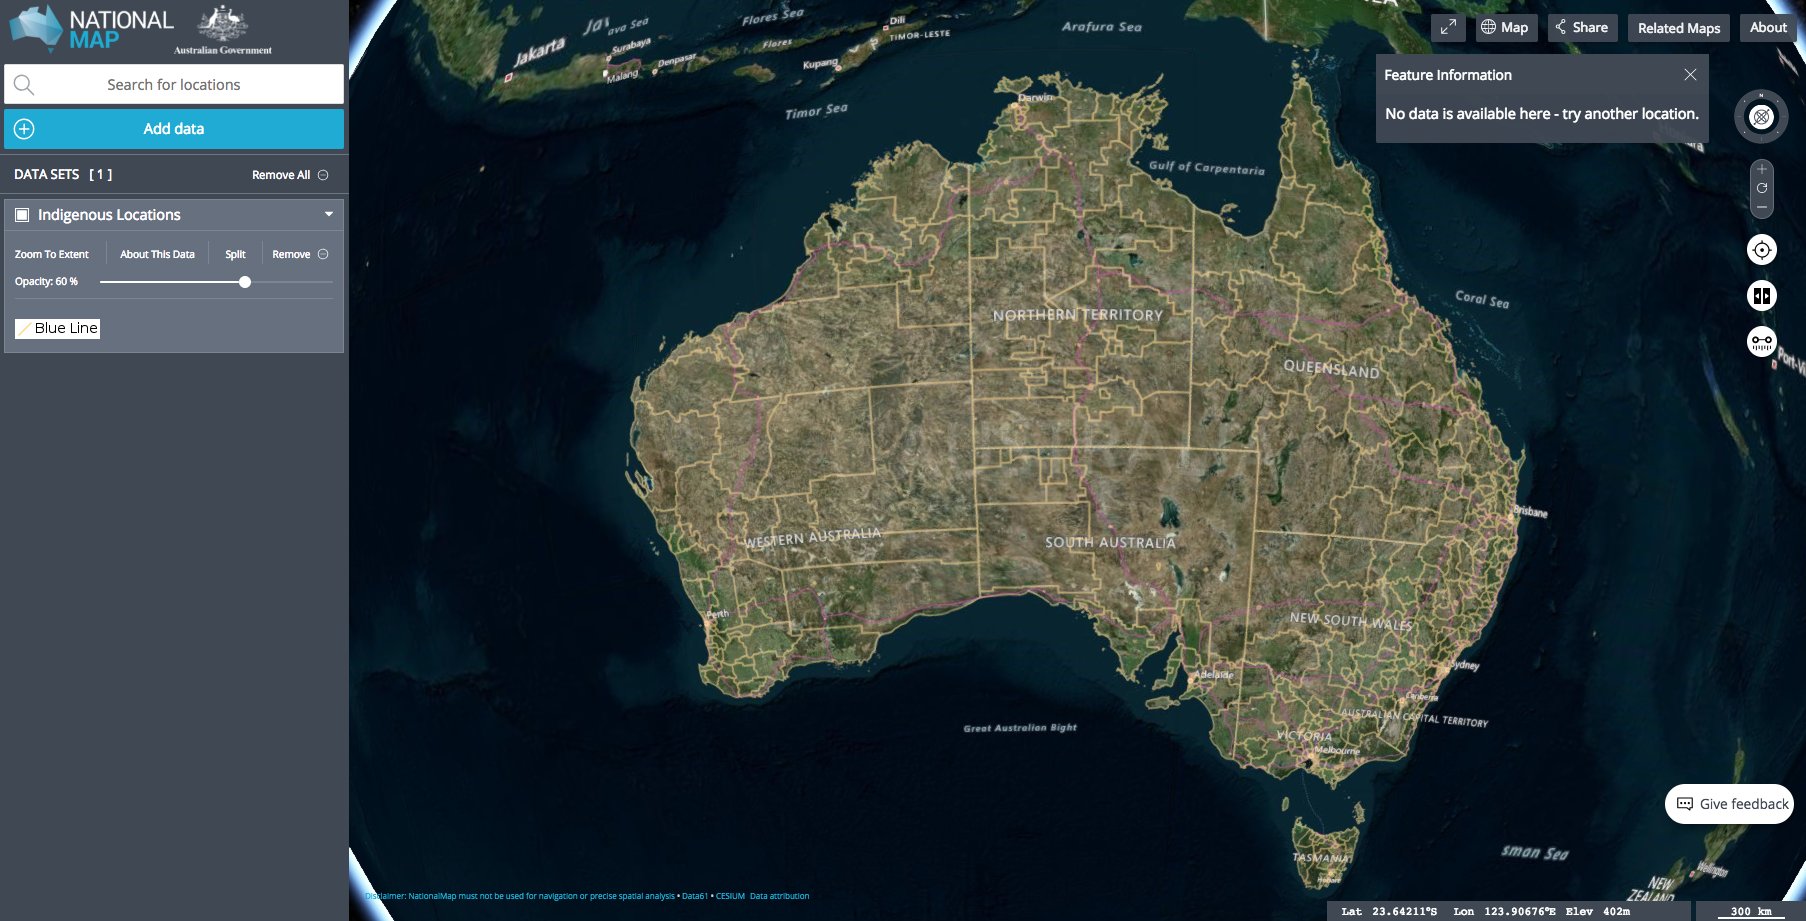
Going to “Add data” from the main page opens up a window that presents different Administrative Boundary options.
Clicking on “Statistical Boundaries” from this window expands to further options. Here, Indigenous Locations were selected and added to the map.

Selecting Indigenous Locations as above shows all of its boundaries across Australia, and the user can zoom into specific areas by clicking on certain locations.
In this example, zooming into Coffs Harbour and clicking on one of the boundaries yields another pop-up window that contains a table of associated codes and information in relation to Indigenous Locations.
